The Elliott Wave Theory remains one of the most powerful tools for understanding market structure and predicting price movement. Among its many patterns, the Flat Pattern is one of the most common corrective structures that traders encounter in Forex, stocks, and cryptocurrency markets. Learning how to identify and trade the Flat pattern correctly can significantly improve your accuracy and profitability.
In this complete guide, you will learn what a Flat pattern is, how it forms, how to identify it on charts, and the best strategies to trade it successfully in real market conditions.
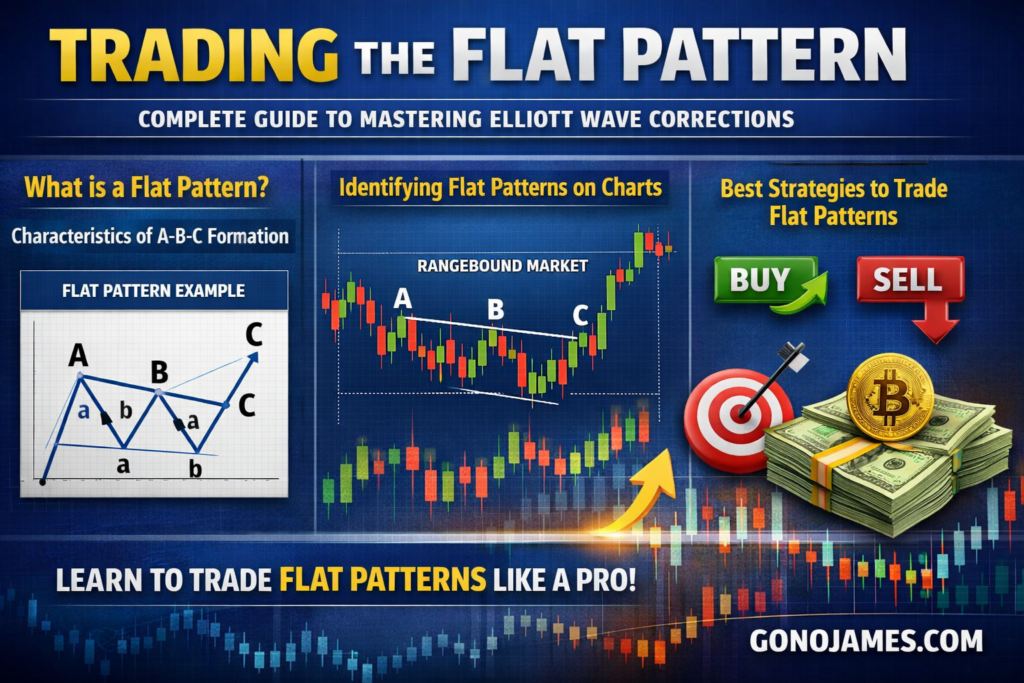
Understanding the Elliott Wave Flat Pattern
The Flat pattern is a corrective wave structure that appears during market consolidation. It usually forms after a strong impulsive move and signals that the market is taking a pause before continuing the main trend.
A Flat pattern consists of three waves:
- Wave A
- Wave B
- Wave C
The structure follows a 3-3-5 formation, meaning:
- Wave A forms in three smaller waves
- Wave B forms in three smaller waves
- Wave C forms in five smaller waves
This pattern typically moves sideways rather than strongly trending up or down, which is why it is known as a “flat” correction.
Flat patterns often occur in Wave 4 or Wave B within the Elliott Wave cycle. Understanding where the pattern forms in the larger wave structure helps traders predict the next major market move.
Types of Flat Patterns
There are three main types of Flat patterns in Elliott Wave trading. Each type provides different trading opportunities and market signals.
1. Regular Flat
The Regular Flat pattern is the most common type. In this structure:
- Wave B ends near the start of Wave A
- Wave C ends near the end of Wave A
This creates a balanced sideways movement. The market corrects but does not move strongly beyond previous levels.
2. Expanded Flat
The Expanded Flat is a powerful pattern that often traps traders. In this structure:
- Wave B moves beyond the start of Wave A
- Wave C extends strongly beyond Wave A
This pattern creates false breakouts and strong reversals. It is very popular among professional traders because it offers excellent entry opportunities.
3. Running Flat
The Running Flat is less common but very strong. In this structure:
- Wave B moves beyond Wave A
- Wave C fails to reach the end of Wave A
This indicates strong trend continuation. The market shows high momentum and often resumes the main trend quickly.
How to Identify a Flat Pattern on the Chart
To trade the Flat pattern successfully, traders must first learn to identify it correctly. Many beginners confuse it with other corrective structures such as zigzags or triangles.
Here are the key characteristics of a Flat pattern:
Sideways Movement:
Flat patterns usually move sideways rather than trending strongly. If the market is moving horizontally after a strong trend, a flat correction may be forming.
Wave Structure:
Always check for the 3-3-5 structure. Wave A and Wave B must have three smaller waves, while Wave C must have five smaller waves.
Wave B Retracement:
Wave B typically retraces most or all of Wave A. In expanded flats, it even goes beyond Wave A.
Wave C Direction:
Wave C usually moves strongly and completes the correction. It often creates the best trading opportunity.
Using multiple timeframes can help confirm the structure. Higher timeframes like H1, H4, and Daily charts provide more reliable Elliott Wave patterns than lower timeframes.
Best Strategy to Trade the Flat Pattern
Trading the Flat pattern requires patience and proper confirmation. The best trading opportunity usually appears during Wave C because it often moves strongly and quickly.
Step 1: Identify the Correction
First, confirm that the market is in a corrective phase rather than an impulsive trend. Look for sideways movement and overlapping price action.
Step 2: Label Wave A and Wave B
Mark Wave A and Wave B carefully. Ensure both waves form three-wave structures. If Wave B retraces deeply or breaks beyond Wave A, an expanded flat may be forming.
Step 3: Wait for Wave C Setup
Wave C provides the highest probability trade. Once Wave B completes, prepare for Wave C to begin. Wave C usually moves in five waves and often creates strong momentum.
Step 4: Entry Point
Enter the trade at the beginning of Wave C after confirmation. You can use:
- Candlestick reversal patterns
- Support and resistance levels
- Trendline breakouts
- Volume confirmation
For a bullish flat pattern, enter a BUY trade at the start of Wave C upward.
For a bearish flat pattern, enter a SELL trade at the start of Wave C downward.
Step 5: Stop-Loss Placement
Risk management is essential. Place your stop-loss:
- Below Wave B low for BUY trades
- Above Wave B high for SELL trades
This protects your capital if the pattern becomes invalid.
Step 6: Take-Profit Targets
Wave C often moves strongly and can be measured using Fibonacci tools. Common targets include:
- 100% of Wave A
- 1.272 extension of Wave A
- 1.618 extension for expanded flats
You can also target major support and resistance levels.
Tips for Successful Flat Pattern Trading
Use Higher Timeframes:
Flat patterns on H1, H4, and Daily charts are more reliable than those on lower timeframes.
Combine with Support and Resistance:
Flat patterns near strong support or resistance levels provide better trading opportunities.
Avoid Overtrading:
Not every sideways market is a flat pattern. Wait for clear structure before entering trades.
Use Confirmation Tools:
Combine Elliott Wave with RSI, MACD, or price action for stronger confirmation.
Practice Wave Counting:
Correct wave counting takes time and experience. Practice on historical charts to improve accuracy.
Common Mistakes to Avoid
Many traders lose money because they misidentify the pattern. Here are common mistakes:
- Entering trades too early before Wave B completes
- Ignoring the 3-3-5 structure
- Trading on very low timeframes
- Not using stop-loss
- Forcing wave counts where none exist
Patience and discipline are key to mastering Elliott Wave trading.
Conclusion
The Flat pattern is one of the most important corrective structures in Elliott Wave trading. When understood and applied correctly, it can provide high-probability trading opportunities with excellent risk-to-reward ratios.
By learning to identify the 3-3-5 structure, waiting for Wave C confirmation, and using proper risk management, traders can use the Flat pattern to improve consistency and profitability in Forex, stocks, and cryptocurrency markets.
Mastering Flat pattern trading takes practice, but once you understand its structure and behavior, it becomes a powerful tool for predicting market direction and capturing profitable trades.