The Elliott Wave Principle is one of the most respected and widely used forms of technical analysis in the financial markets. Traders across Forex, cryptocurrency, and stock markets rely on it to understand market cycles and forecast future price movements. At its core, the theory suggests that markets move in repetitive wave patterns driven by collective investor psychology. These waves form fractal structures that repeat across all time frames, allowing traders to anticipate potential market behavior.
Among the many formations within Elliott Wave theory, two of the most important complex corrective patterns are the Double Three and Triple Three. These patterns help traders understand prolonged sideways price movements and extended market consolidations. While many traders focus on impulsive waves for trend direction, understanding corrective patterns like Double Three and Triple Three is essential for identifying consolidation phases and preparing for the next major move.
Understanding the Foundation of Elliott Wave Theory
Before diving into Double Three and Triple Three patterns, it is crucial to understand the basic structure of Elliott Wave theory. Developed by Ralph Nelson Elliott in the 1930s, the theory proposes that financial markets move in predictable wave patterns. These patterns reflect the emotional behavior of traders and investors, oscillating between optimism and pessimism.
There are two primary wave types in Elliott Wave theory:
Impulsive Waves:
These waves move in the direction of the main trend and consist of five sub-waves. They represent strong momentum and directional movement.
Corrective Waves:
Corrective waves move against the main trend and typically consist of three sub-waves. They represent market pauses or consolidations before the next impulsive move.
While basic corrective patterns such as Zigzags, Flats, and Triangles are relatively easy to identify, markets often display more complex corrective structures. This is where Double Three and Triple Three patterns become extremely important.
The Structure of Corrective Waves
Corrective waves generally fall into three main categories:
- Zigzag patterns
- Flat patterns
- Triangle patterns
These patterns represent simple corrections. However, when markets experience prolonged sideways movement, simple corrections may combine to form more complex structures. Double Three and Triple Three patterns are examples of such complex combinations.
These formations extend the duration of consolidation and often appear when the market lacks strong directional momentum. Understanding them allows traders to avoid false signals and trade more effectively within consolidation zones.
Double Three Pattern Explained
The Double Three pattern is a complex corrective structure that combines two simple corrective patterns into one larger formation. Its primary purpose is to extend a correction and create a sideways market structure rather than a sharp retracement.
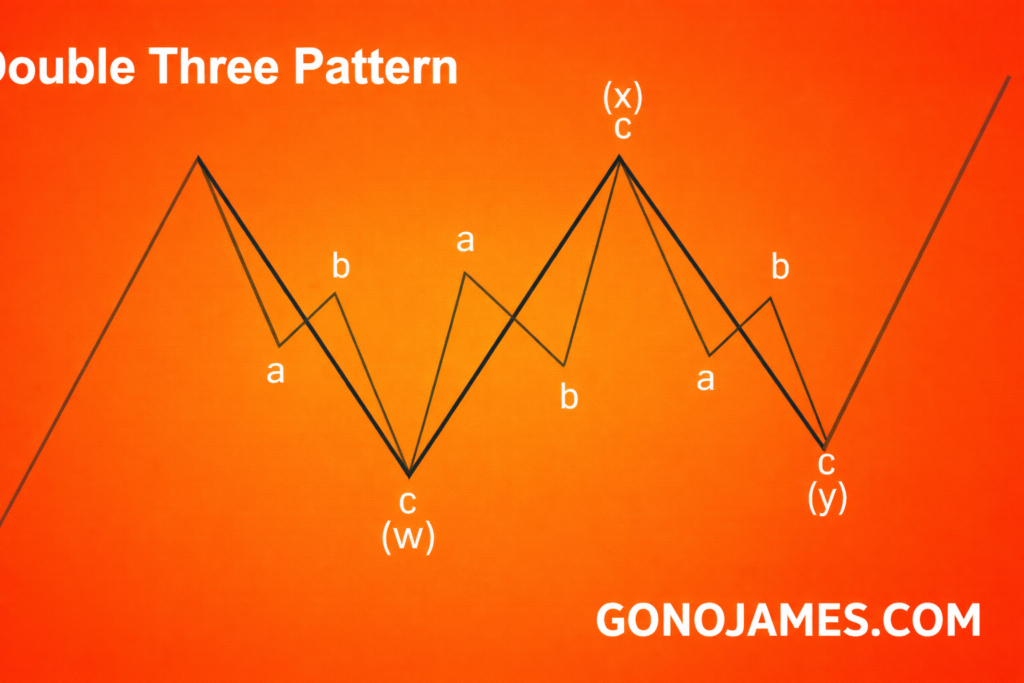
Structure of a Double Three
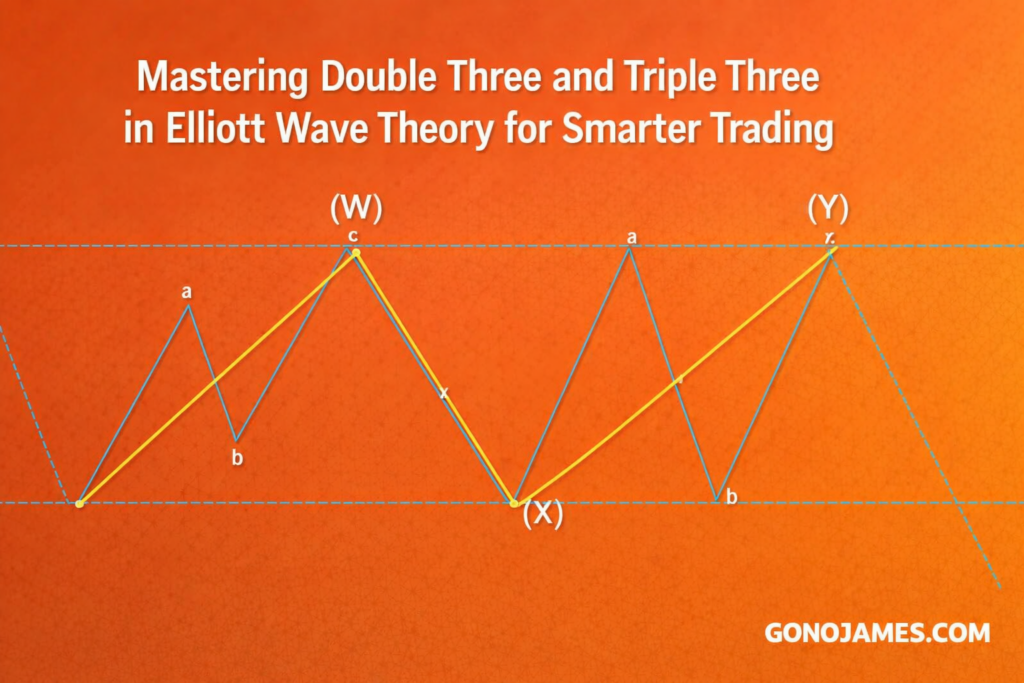
The Double Three pattern follows a W-X-Y structure:
- Wave W: The first corrective pattern (Zigzag, Flat, or Triangle)
- Wave X: A connecting wave that links the two corrections
- Wave Y: The second corrective pattern
Each wave can consist of its own internal sub-waves, making the overall structure complex and often difficult to identify in real time.
Key Characteristics of a Double Three
- Typically moves sideways rather than trending strongly
- Occurs after a strong impulsive wave
- Extends the duration of correction
- Combines two corrective patterns
- Often appears in highly liquid markets like Forex and crypto
Example Scenario
Imagine the market completes a strong bullish impulsive move. Instead of reversing sharply, price begins to consolidate. The first correction (Wave W) forms as a Zigzag. Then price moves into a small recovery (Wave X), followed by another correction (Wave Y), which could be a Flat or Triangle.
The result is a prolonged sideways movement that confuses many traders but actually signals consolidation before the next major move.
Triple Three Pattern Explained
The Triple Three pattern is an extended version of the Double Three. It combines three corrective patterns instead of two, making it more complex and less common.
Structure of a Triple Three
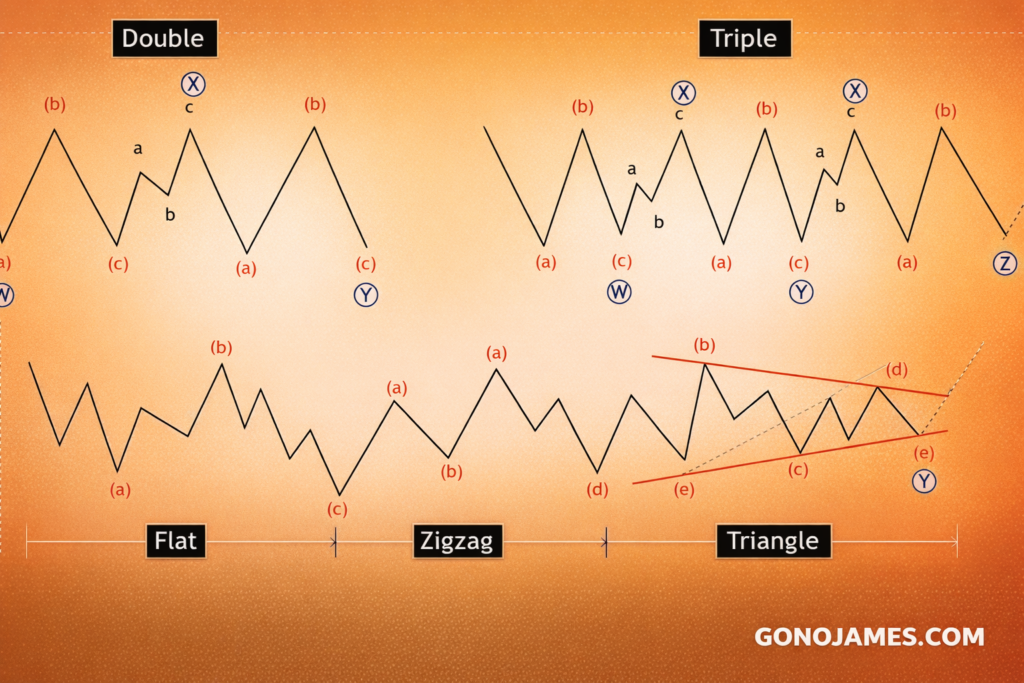
The Triple Three follows a W-X-Y-X-Z structure:
- Wave W: First corrective pattern
- Wave X: First connecting wave
- Wave Y: Second corrective pattern
- Wave X: Second connecting wave
- Wave Z: Third corrective pattern
This structure creates an extended sideways consolidation that can last for a long period.
Characteristics of a Triple Three
- More complex than Double Three
- Occurs during extended consolidation phases
- Contains three corrective patterns
- Includes two connecting waves
- Signals strong market indecision
Example Scenario
Consider a market that has been trending strongly upward. After reaching a key resistance level, it enters a correction. Instead of forming a simple retracement, the market forms a Flat (Wave W), then a connecting Zigzag (X), followed by a Triangle (Wave Y), another connector (X), and finally a Zigzag (Wave Z).
This extended structure creates a prolonged sideways movement before the market resumes its main trend.
How to Identify Double Three and Triple Three Patterns
Identifying these patterns requires patience and experience. However, several guidelines can help traders recognize them more easily.
1. Look for Sideways Price Action
Both patterns are characterized by sideways movement rather than sharp directional moves.
2. Identify Multiple Corrective Patterns
Watch for combinations of Zigzags, Flats, and Triangles forming within one larger structure.
3. Observe Connecting Waves
The X waves connect the corrective patterns and maintain the sideways structure.
4. Use the Alternation Principle
Different corrective patterns often alternate. For example, if Wave W is a Zigzag, Wave Y might be a Flat.
5. Monitor Volume
Volume often decreases during complex corrections, reflecting reduced market conviction.
Trading Applications of Double Three and Triple Three
Understanding these patterns can significantly improve trading performance.
Range Trading Opportunities
Since these patterns indicate sideways movement, traders can buy near support and sell near resistance.
Breakout Preparation
When a Double Three or Triple Three completes, a strong breakout often follows. Traders can prepare for this move.
Risk Management
Recognizing consolidation helps traders avoid entering trades too early and reduces false signals.
Indicator Confirmation
Combining Elliott Wave analysis with indicators like RSI, MACD, or moving averages improves accuracy.
Challenges Traders Should Consider
Despite their usefulness, Double Three and Triple Three patterns come with challenges:
Complexity:
They are difficult to identify in real time.
Subjectivity:
Different traders may interpret wave structures differently.
Patience Required:
These patterns take time to complete and require disciplined analysis.
Confirmation Needed:
Entering trades before pattern completion can lead to losses.
Conclusion
Double Three and Triple Three patterns are essential components of advanced Elliott Wave analysis. They help traders understand complex corrective phases and prolonged market consolidations. While these patterns can be challenging to identify, mastering them provides a significant edge in trading.
By recognizing these structures, traders can avoid false breakouts, trade consolidation ranges more effectively, and prepare for powerful impulsive moves once the correction ends. When combined with proper risk management and other technical tools, Double Three and Triple Three patterns become powerful assets in any trader’s strategy.
For traders seeking long-term consistency and accuracy in Forex, stocks, or cryptocurrency markets, mastering these advanced Elliott Wave corrective patterns is a valuable step toward professional-level trading success.