Support and Resistance are among the most powerful and widely used concepts in technical analysis. Every successful Forex trader, from beginners to professionals, relies on these levels to understand market behavior and make smarter trading decisions. Although the idea of support and resistance is easy to grasp, mastering it requires patience, practice, and a clear understanding of market psychology.
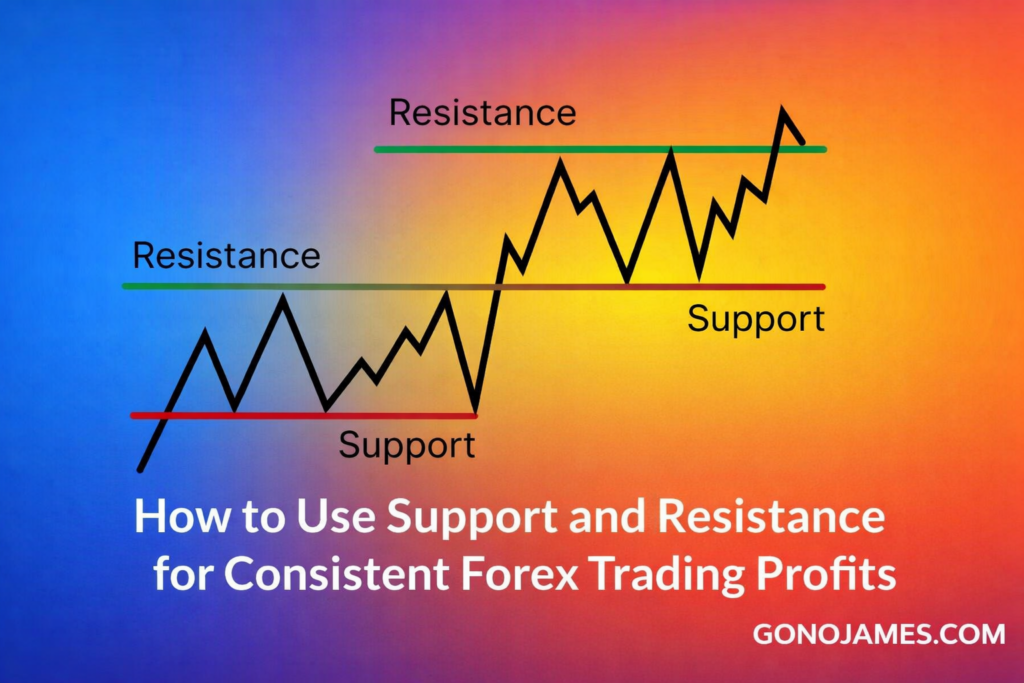
In this comprehensive guide, you will learn what support and resistance are, how they work in Forex trading, and how you can use them effectively to improve your trading performance and consistency.
What Are Support and Resistance?
Support and Resistance are price zones on a chart where price tends to reverse, pause, or slow down before continuing its trend. These zones represent historical areas where buyers and sellers previously reacted strongly, and this behavior often repeats itself in the future.
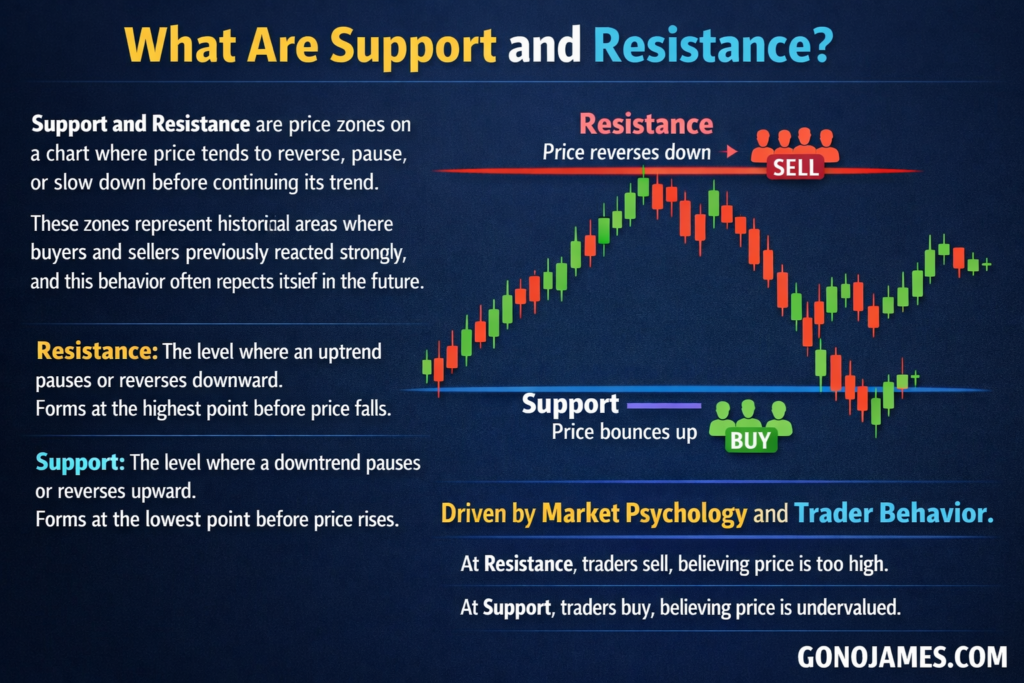
Resistance is the price level where an uptrend pauses or reverses downward. It forms at the highest level reached before price starts to fall.
Support, on the other hand, is the price level where a downtrend pauses or reverses upward. It forms at the lowest level before price begins to rise again.
These levels are not random. They are created by market psychology and trader behavior. When price reaches resistance, many traders start selling because they believe the price is too high. When price reaches support, many traders start buying because they believe the price is undervalued.
Understanding Market Psychology Behind Support and Resistance
To truly master support and resistance, you must understand the psychology behind them.
- Resistance represents fear: Traders fear that price will not go higher, so they start selling.
- Support represents greed: Traders believe price is cheap, so they start buying.
This collective behavior creates visible zones on the chart where price reacts repeatedly. The more times price touches a level without breaking it, the stronger that support or resistance becomes.
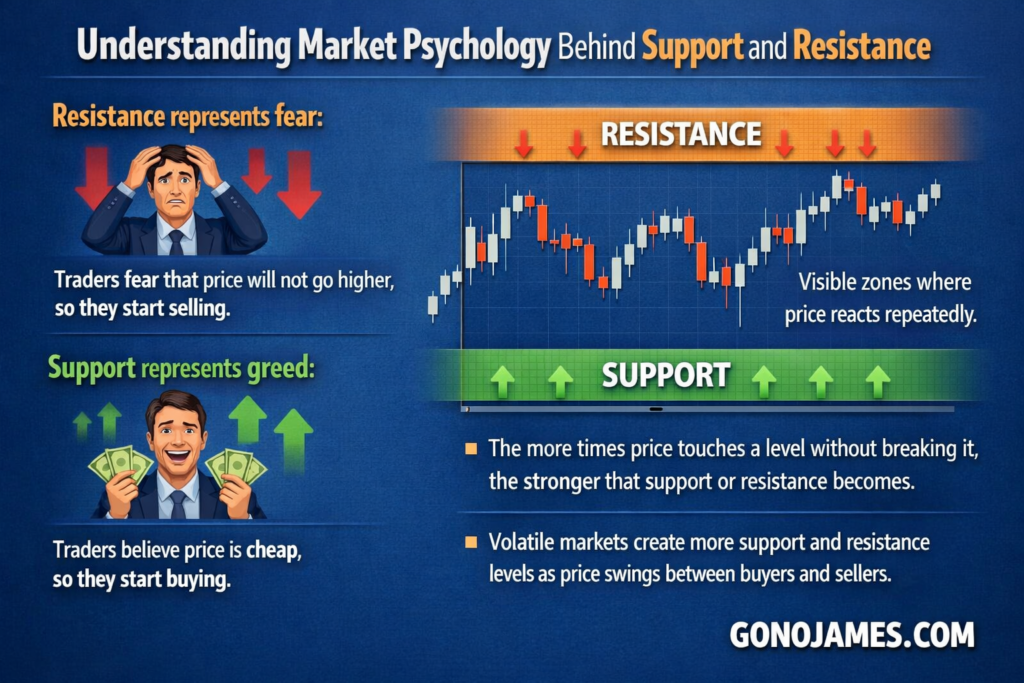
In volatile markets, more support and resistance levels are created because price fluctuates more frequently between buyers and sellers.
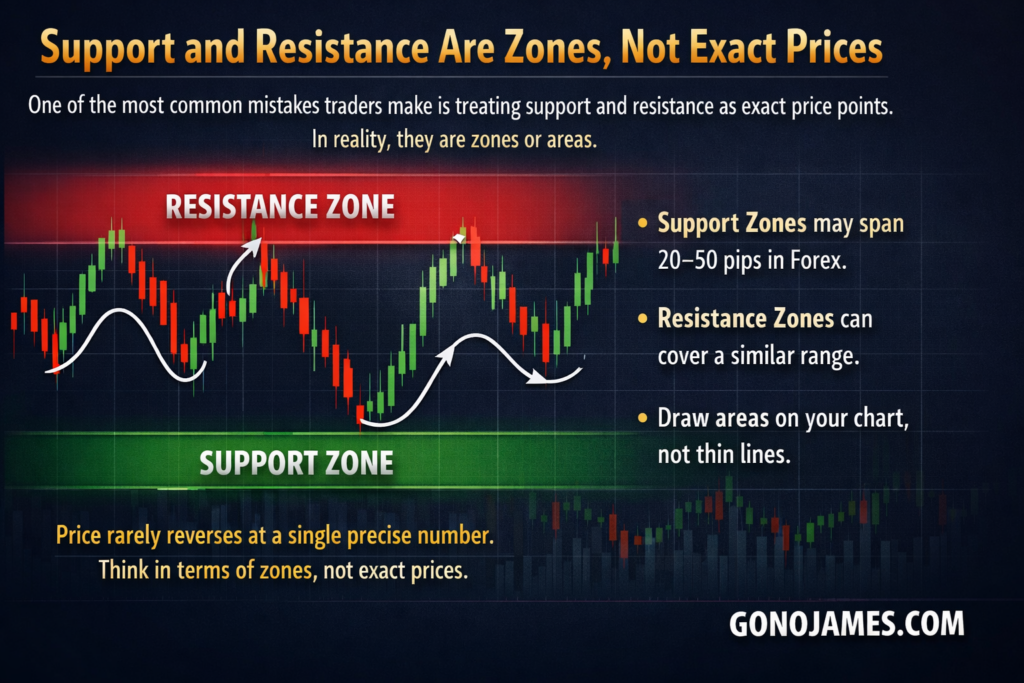
Support and Resistance Are Zones, Not Exact Prices
One of the most common mistakes traders make is treating support and resistance as exact price points. In reality, they are zones or areas.
Price rarely reverses at a single precise number. Instead, it moves within a small range before reversing. Viewing these levels as zones helps traders avoid entering or exiting trades too early.
For example:
- A strong support zone may span 20–50 pips in Forex.
- A resistance zone may also cover a similar range.
Always draw support and resistance as areas rather than thin lines on your chart.
Types of Support and Resistance Levels
There are three main types of support and resistance levels that traders should understand.
1. Hard Levels (Static Levels)
These are fixed price levels that do not change unless price breaks them. Examples include:
- Horizontal support and resistance
- Trendlines
- Fibonacci retracement levels
These are the most commonly used levels in technical analysis.
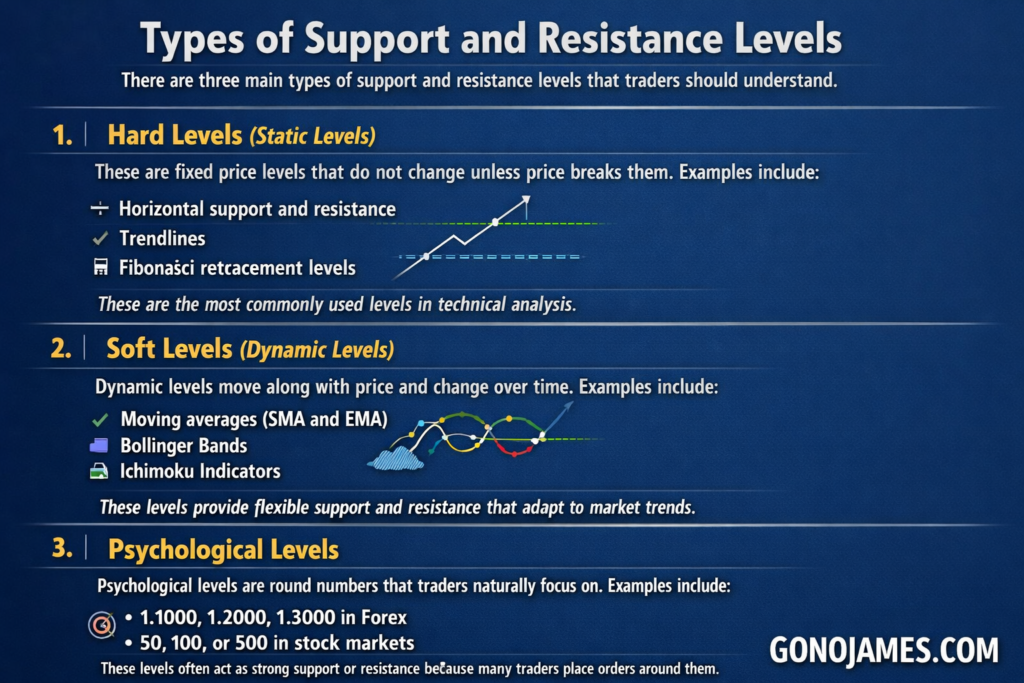
2. Soft Levels (Dynamic Levels)
Dynamic levels move along with price and change over time. Examples include:
- Moving averages (SMA and EMA)
- Bollinger Bands
- Ichimoku indicators
These levels provide flexible support and resistance that adapt to market trends.
3. Psychological Levels
Psychological levels are round numbers that traders naturally focus on. Examples include:
1.1000, 1.2000, 1.3000 in Forex
50, 100, or 500 in stock markets
These levels often act as strong support or resistance because many traders place orders around them.
Role Reversal: When Support Becomes Resistance
One of the most important principles in trading is the role reversal of support and resistance.
When price breaks below a support level, that support often becomes a new resistance level. Similarly, when price breaks above resistance, that resistance becomes new support.
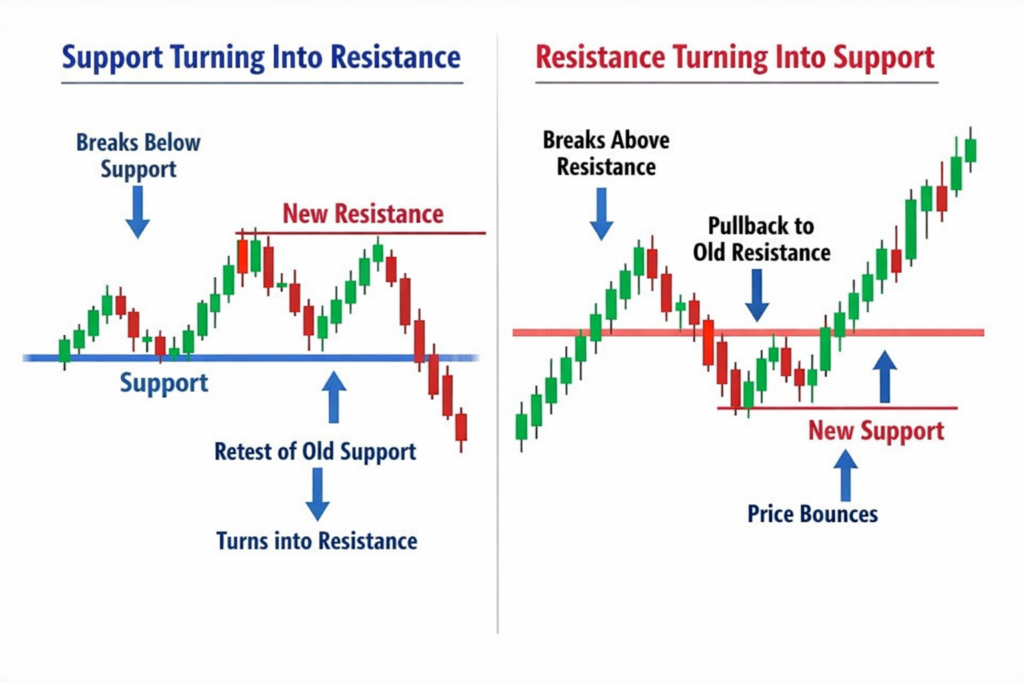
Example: Support Turning Into Resistance
If price breaks below a strong support zone and then retraces upward, it often retests that old support. Once retested, it may act as resistance and push price downward again.
Example: Resistance Turning Into Support
If price breaks above a strong resistance zone and then pulls back, the old resistance often becomes support. Price may bounce from that level and continue rising.
Understanding this role change helps traders identify strong entry points and confirm new trends.
Relationship Between Trends and Support/Resistance
Support and resistance play a major role in trend formation.
- In an uptrend, price continuously breaks resistance and forms higher support levels.
- In a downtrend, price continuously breaks support and forms lower resistance levels.
A trend becomes stronger when price repeatedly breaks a level, retests it, and continues moving in the same direction. This breakout and retest pattern is one of the most reliable signals in Forex trading.
Common Trading Behaviors Around Support and Resistance
Most traders use support and resistance in two main ways:
- Buying at support and selling at resistance
- Trading breakouts and retests
Both approaches can be profitable when used correctly and with proper risk management.
Strategy 1: Buy Support and Sell Resistance
This is one of the most popular and beginner-friendly trading strategies.
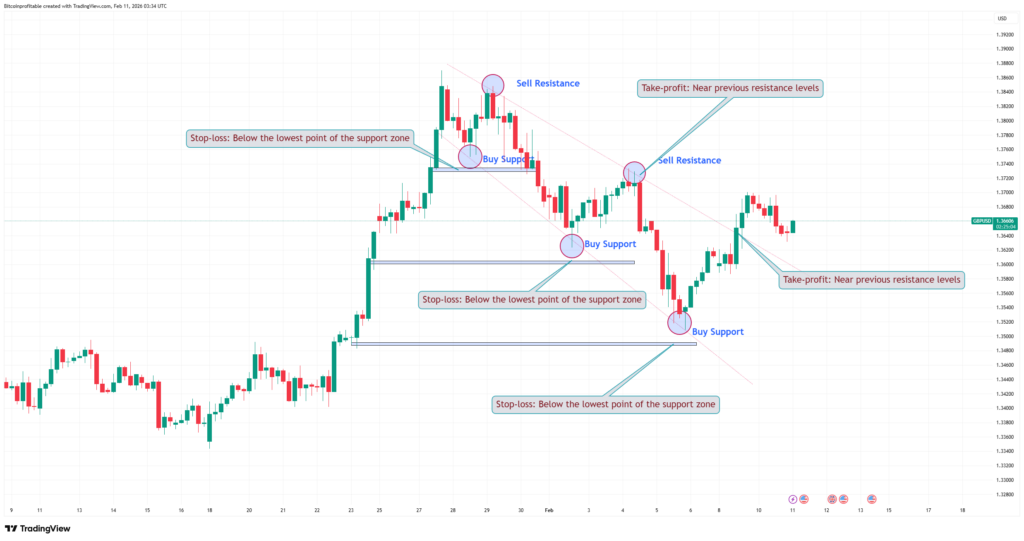
Buy at Support
Open a buy trade when price reaches a strong support zone and shows signs of bouncing upward.
- Entry: When price touches support and begins to rise
- Stop-loss: Below the lowest point of the support zone
- Take-profit: Near previous resistance levels
Sell at Resistance
Open a sell trade when price reaches a strong resistance zone and shows signs of falling.
- Entry: When price touches resistance and begins to drop
- Stop-loss: Above the highest point of resistance
- Take-profit: Near previous support levels
Always prioritize strong zones that price has respected multiple times.
Strategy 2: Breakout and Retest Trading
This strategy is often considered safer and more reliable because it confirms a new trend.
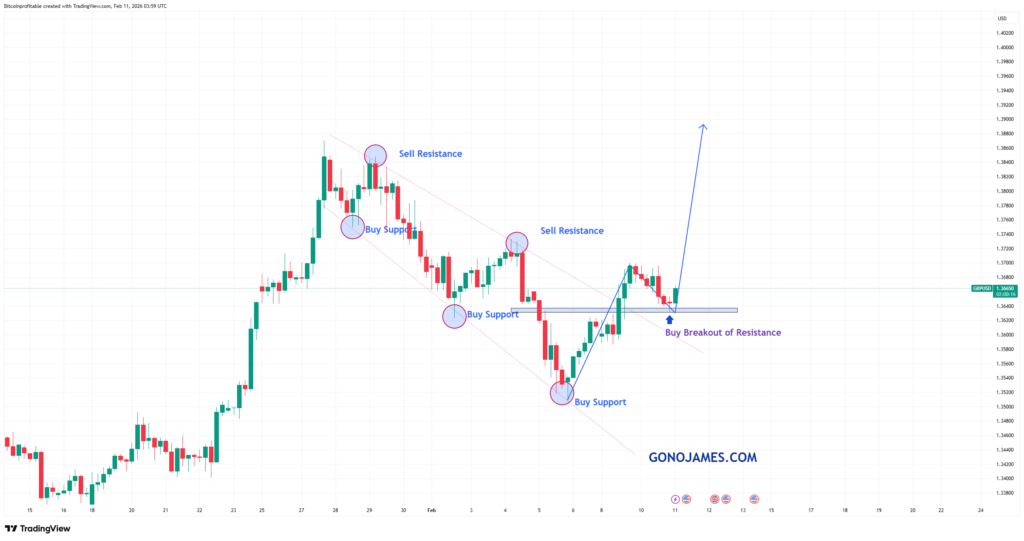
Buy Breakout of Resistance
- Wait for price to break above resistance
- Wait for a retest of the broken level
- Enter buy when price bounces upward
Stop-loss: Below the new support
Take-profit: Next resistance level
Sell Breakout of Support
- Wait for price to break below support
- Wait for retest of the broken level
- Enter sell when price falls again
Stop-loss: Above the new resistance
Take-profit: Next support level
Patience is key. Never chase breakouts without waiting for confirmation.
Final Thoughts
Support and resistance remain fundamental tools for every Forex trader. They help you understand price behavior, market psychology, and trend formation. While the concept is simple, mastering it takes time, observation, and consistent practice.
Always remember:
- Support and resistance are zones, not exact prices
- Strong levels are tested multiple times
- Breakouts and retests confirm trends
- Risk management is essential
Start practicing these techniques on a demo account before using real money. With patience and discipline, mastering support and resistance can significantly improve your trading accuracy and confidence.
By understanding and applying these principles correctly, you will build a solid foundation for long-term success in Forex trading.