In technical analysis, the Bullish Harami candlestick pattern is considered one of the most reliable and preferred signals for identifying potential bullish reversals in the Forex market. Many professional traders use this pattern to catch strong upward trends early and enter trades with confidence.
But what exactly is the Bullish Harami pattern? What does it mean in Forex trading, and how can you use it effectively to increase your profitability? In this complete guide, you’ll learn everything you need to know about this powerful candlestick pattern and how to apply it in real trading.
What Is a Bullish Harami Candlestick Pattern?
The Bullish Harami is a Japanese candlestick pattern consisting of two candles. It signals a potential reversal from a downtrend to an uptrend and often appears at the bottom of bearish markets.
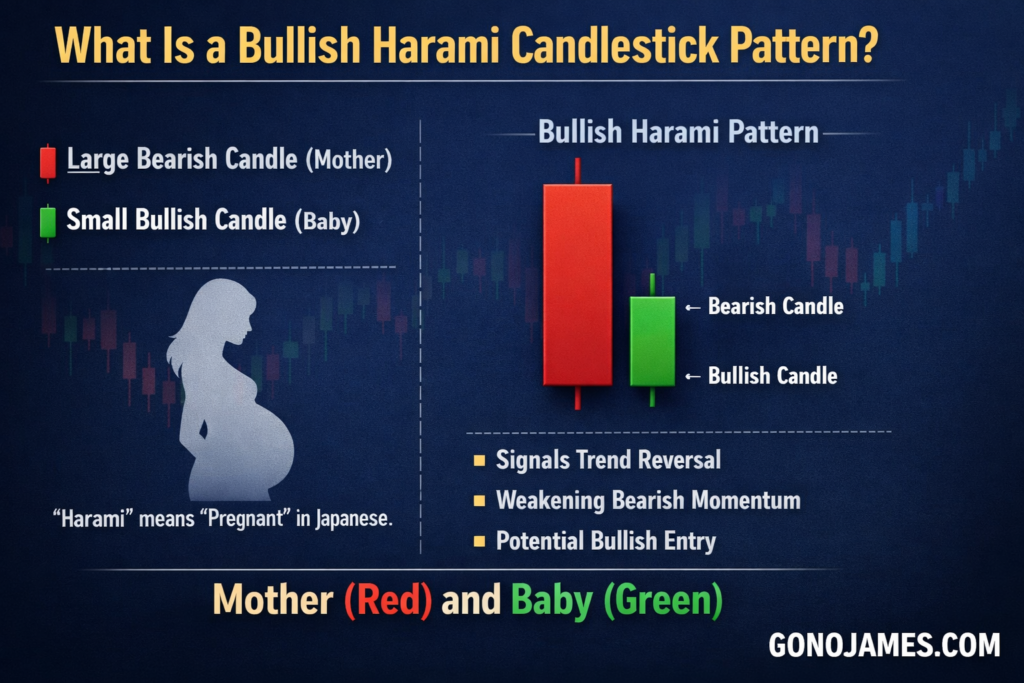
This pattern includes two main components:
- The first candle is a strong bearish (red) candle showing selling pressure.
- The second candle is a smaller bullish (green) candle that forms completely within the body of the first candle.
Because of its shape, the pattern resembles a pregnant woman. In Japanese, “Harami” means pregnant, which is why the pattern carries this unique name. The large first candle represents the “mother,” while the smaller second candle represents the “baby.”
In Western trading terminology, this pattern is often referred to as the Bullish Inside Bar, because the second candle forms within the range of the first.
The Bullish Harami is widely respected because it indicates weakening bearish momentum and the possible beginning of bullish control. When used correctly, it can provide safe and high-probability entry opportunities for traders.
Why the Bullish Harami Is Important in Forex Trading
The Bullish Harami pattern is popular among Forex traders because it offers early signs of a trend reversal. It shows that sellers are losing strength and buyers are beginning to step into the market.
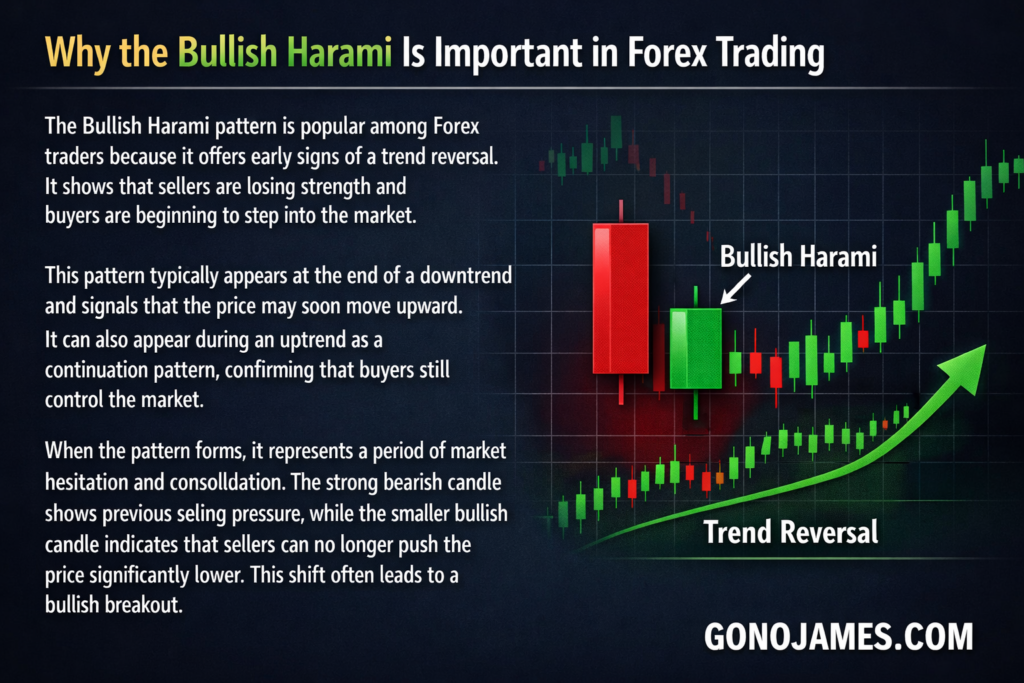
This pattern typically appears at the end of a downtrend and signals that the price may soon move upward. It can also appear during an uptrend as a continuation pattern, confirming that buyers still control the market.
When the pattern forms, it represents a period of market hesitation and consolidation. The strong bearish candle shows previous selling pressure, while the smaller bullish candle indicates that sellers can no longer push the price significantly lower. This shift often leads to a bullish breakout.
Market Psychology Behind the Bullish Harami
Understanding the psychology behind candlestick patterns can greatly improve your trading accuracy. The Bullish Harami reflects a clear change in market sentiment.
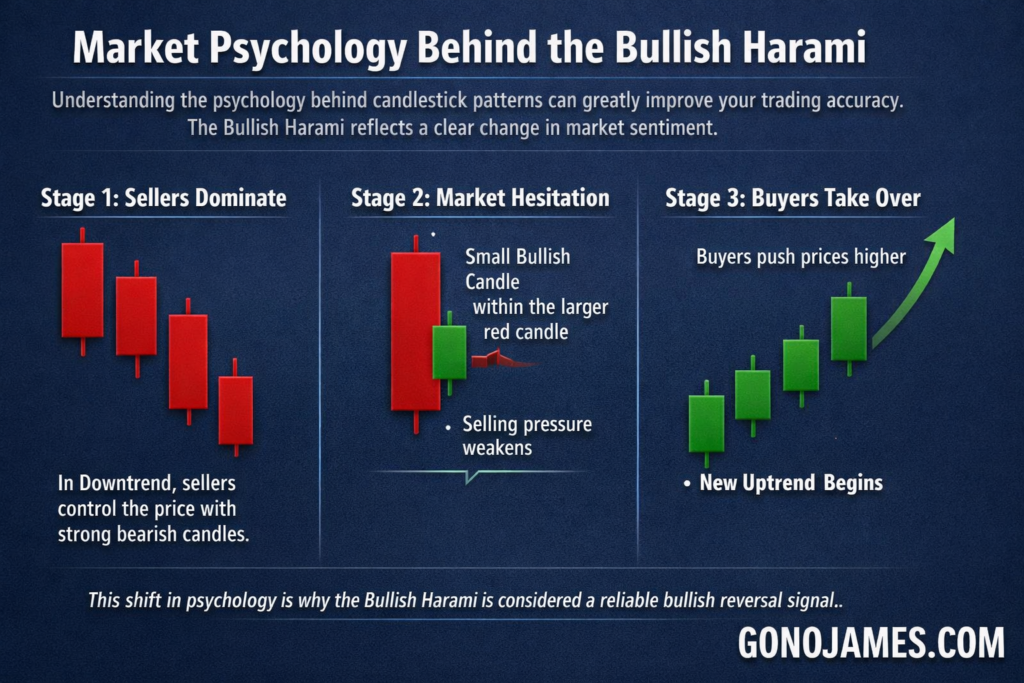
Stage 1: Sellers Dominate
Before the pattern forms, the market is usually in a downtrend. Sellers control the price and push it lower with strong bearish candles. Most traders expect the price to continue falling.
Stage 2: Market Hesitation
The smaller bullish candle inside the first candle shows that selling pressure is weakening. Buyers begin entering the market, and price movement slows down. This signals a potential shift in control.
Stage 3: Buyers Take Over
After the pattern completes, buyers often gain strength and push prices higher. This creates a new uptrend or at least a significant bullish correction.
This shift in psychology is why the Bullish Harami is considered a reliable bullish reversal signal.
Bullish Harami Across Different Timeframes
The Bullish Harami pattern works across all timeframes, making it suitable for scalpers, day traders, and long-term investors.
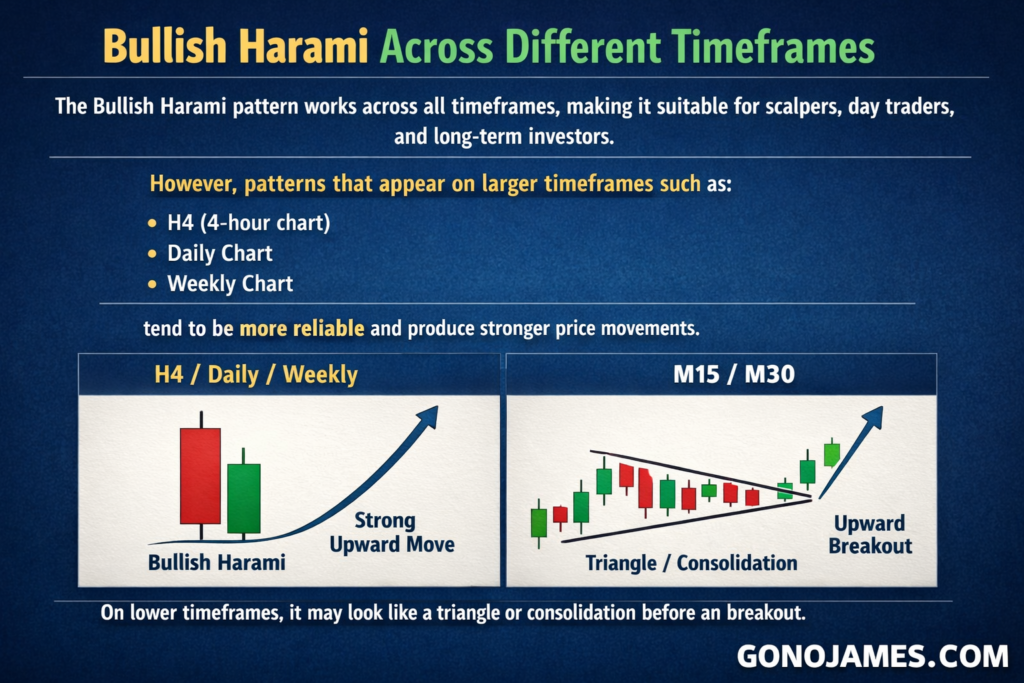
However, patterns that appear on larger timeframes such as:
- H4 (4-hour chart)
- Daily chart
- Weekly chart
tend to be more reliable and produce stronger price movements.
Interestingly, when viewed on smaller timeframes like M15 or M30, a Bullish Harami on a higher timeframe may look like a triangle or consolidation pattern. This represents market accumulation before a breakout or continuation of an uptrend.
Variations of the Bullish Harami Pattern
In addition to the standard Bullish Harami, traders often pay attention to variations that include special candlesticks.
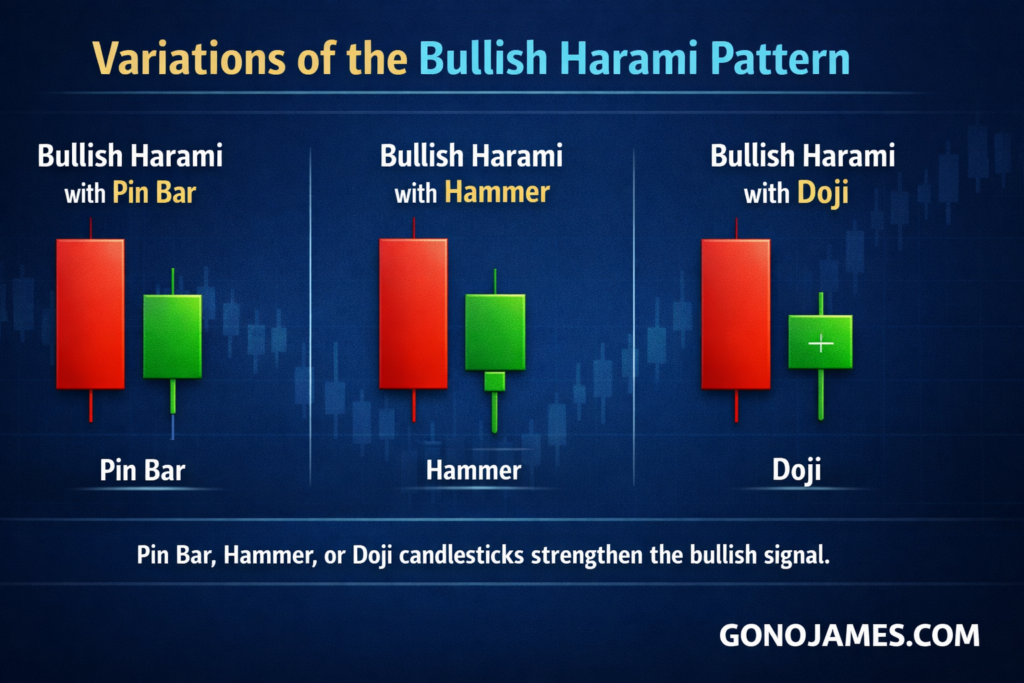
Some popular variations include:
- Bullish Harami with Pin Bar
- Bullish Harami with Hammer
- Bullish Harami with Doji
When the second candle forms as a Pin Bar or Hammer, the bullish signal becomes even stronger. These combinations show strong rejection of lower prices and a higher probability of upward movement.
How to Trade Forex Using the Bullish Harami Pattern
The Bullish Harami is primarily used as a confirmation signal for BUY entries. Since it indicates a potential bullish reversal, traders focus on long positions rather than short trades.
Below are two effective strategies used by professional traders.
Strategy 1: Catch the Market Bottom
This strategy focuses on identifying the end of a downtrend and entering early in a new bullish movement.
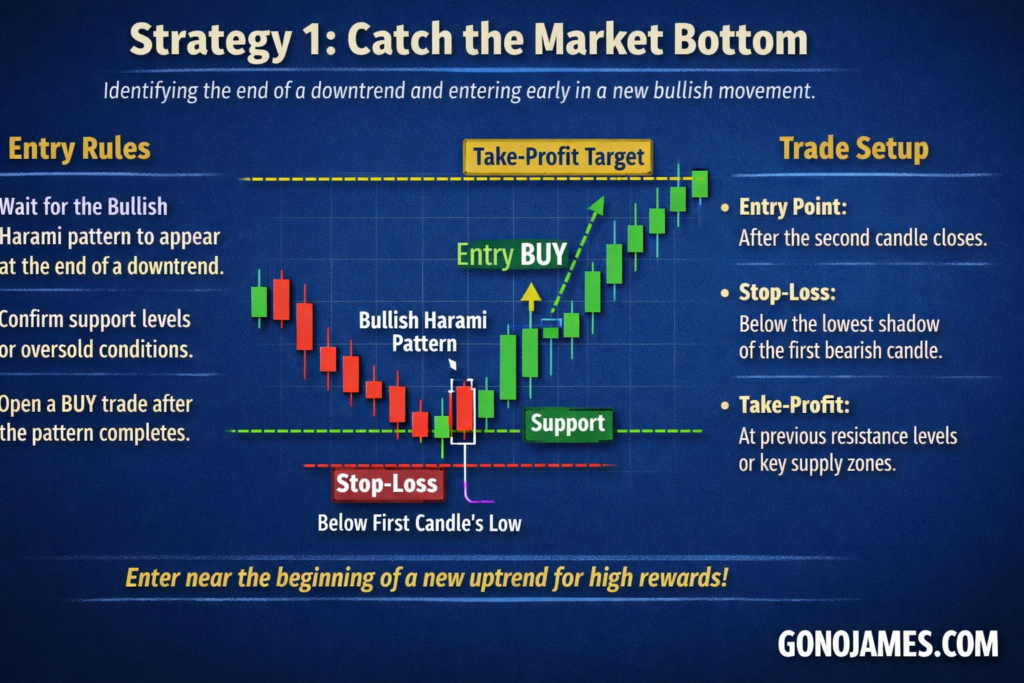
Entry Rules
- Wait for the Bullish Harami pattern to appear at the end of a downtrend.
- Confirm support levels or oversold conditions.
- Open a BUY trade after the pattern completes.
Trade Setup
- Entry Point: After the second candle closes.
- Stop-Loss: Below the lowest shadow of the first bearish candle.
- Take-Profit: At previous resistance levels or key supply zones.
This strategy can generate high rewards because you enter near the beginning of a new uptrend.
Strategy 2: Trade With the Trend
This is a safer and more conservative approach. Instead of catching reversals, you trade in the direction of the existing uptrend.
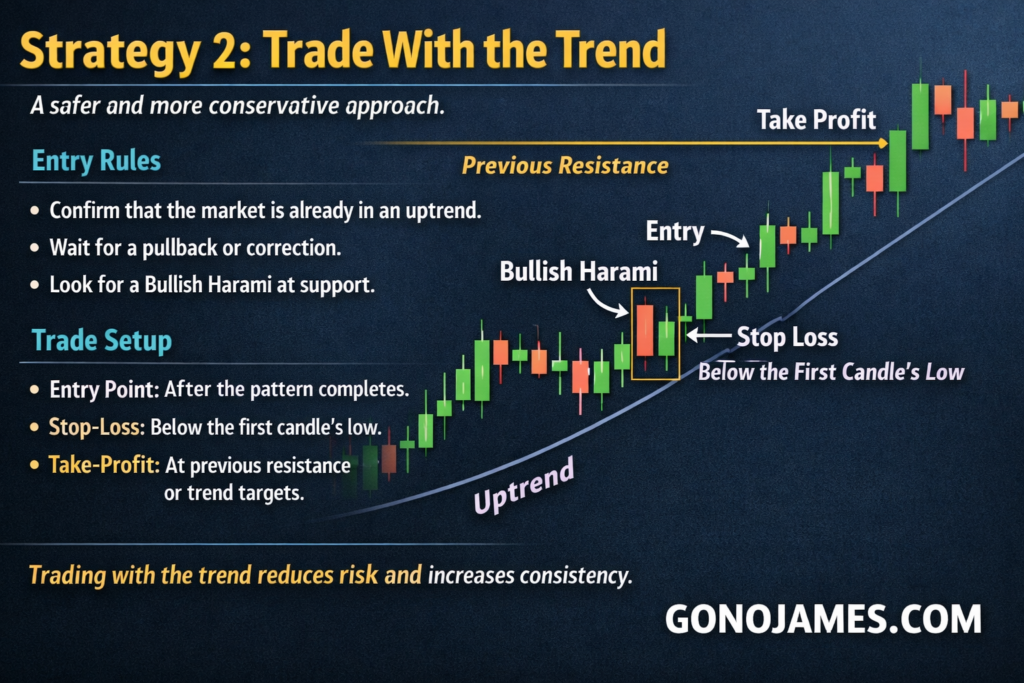
Entry Rules
- Confirm that the market is already in an uptrend.
- Wait for a pullback or correction.
- Look for a Bullish Harami pattern forming at support.
Trade Setup
- Entry Point: After the pattern completes.
- Stop-Loss: Below the first candle’s low.
- Take-Profit: At previous resistance or trend continuation targets.
Trading with the trend reduces risk and increases consistency, making this strategy ideal for beginners.
Tips for Trading the Bullish Harami Successfully
To maximize accuracy and profitability, consider these expert tips:
- Always confirm the trend before trading.
- Combine the pattern with support and resistance levels.
- Use indicators like RSI or moving averages for confirmation.
- Focus on higher timeframes for stronger signals.
- Practice on a demo account before trading live.
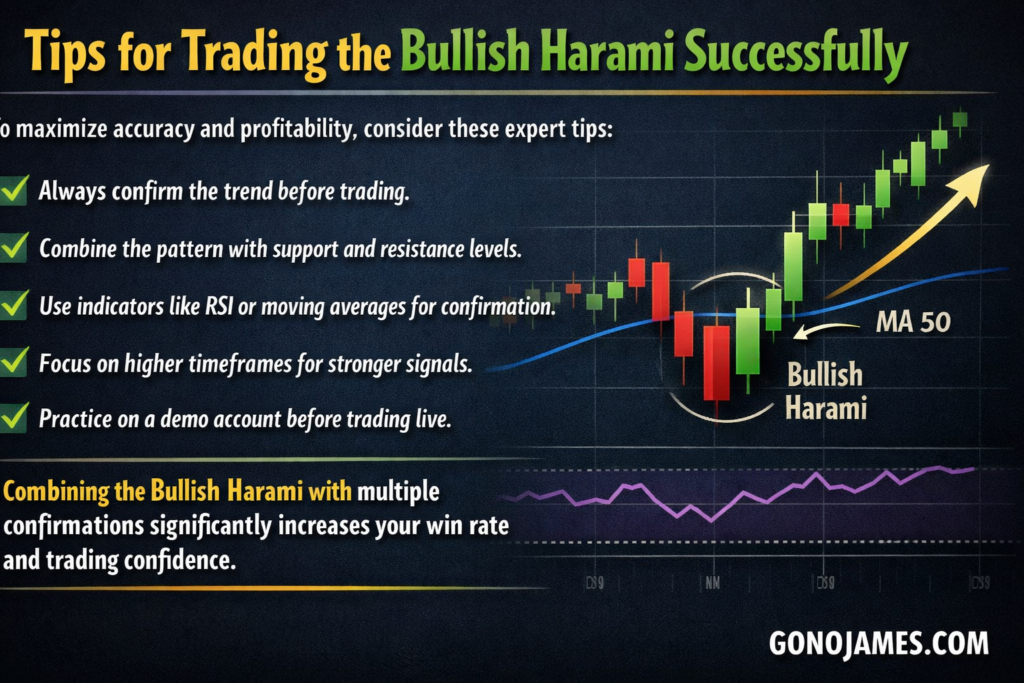
Combining the Bullish Harami with multiple confirmations significantly increases your win rate and trading confidence.
Summary
In Forex trading, candlestick patterns play a crucial role in identifying market opportunities. The Bullish Harami candlestick pattern is one of the most reliable signals for spotting bullish reversals and trend continuations.
It consists of two candles and represents a shift in market sentiment from sellers to buyers. When used correctly, it can provide safe and profitable entry points for BUY trades.
Whether you are a beginner or an experienced trader, mastering the Bullish Harami pattern can improve your technical analysis and help you catch major uptrends in the Forex market.
Start practicing this powerful pattern on a demo account, combine it with strong risk management, and you’ll be on your way to becoming a more confident and successful trader.