Elliott Wave Theory is one of the most powerful and widely respected forms of technical analysis used by traders and investors around the world. This method helps traders understand financial market cycles and forecast future price movements by analyzing patterns formed through investor psychology, price extremes, and collective market behavior. Developed by Ralph Nelson Elliott in the 1930s, the theory proposes that financial markets move in repetitive wave patterns that reflect the emotions and decisions of traders.

Understanding these wave patterns and their fractal nature allows traders to analyze market structure more clearly and anticipate potential trend changes. Elliott Wave Theory is widely applied in Forex, stock, and cryptocurrency markets because of its ability to reveal both short-term opportunities and long-term trends.
Understanding the Fractal Nature of Elliott Wave Theory
One of the most important principles behind Elliott Wave Theory is the concept of fractals. Fractals are complex structures that repeat themselves on different scales. In the financial markets, this means price movements follow similar patterns whether viewed on a one-minute chart or a monthly chart.
Fractal Structure in Price Movements
According to Elliott Wave Theory, each wave in the market can be broken down into smaller waves that follow the same structure as the larger wave. For example, a five-wave impulse pattern on a daily chart may be just one wave of a larger pattern on a weekly chart. This self-similar structure is what makes Elliott Wave analysis so powerful and adaptable.
Because of this fractal nature, traders can analyze the market across multiple timeframes to get a more complete understanding of price behavior. A move that looks like a correction on a smaller timeframe may actually be part of a larger impulsive move on a higher timeframe. Recognizing this relationship helps traders avoid confusion and make better trading decisions.
Practical Trading Implications of Fractals
The fractal nature of Elliott Waves means that traders should always consider multiple timeframes when analyzing the market. By combining short-term and long-term analysis, traders can identify how smaller waves fit within the larger market structure. This multi-timeframe approach improves accuracy in identifying entry points, stop-loss levels, and profit targets.
For example, if a trader sees a bullish impulse wave forming on the daily chart and a smaller corrective wave completing on the one-hour chart, this could present a high-probability buying opportunity aligned with the overall trend.
Elliott Wave Degrees Explained
Elliott Wave Theory categorizes market waves into different degrees based on their size and duration. Each degree represents a different level within the overall market cycle. Understanding these degrees helps traders identify where the market is currently positioned and what type of movement may occur next.
Major Wave Degrees
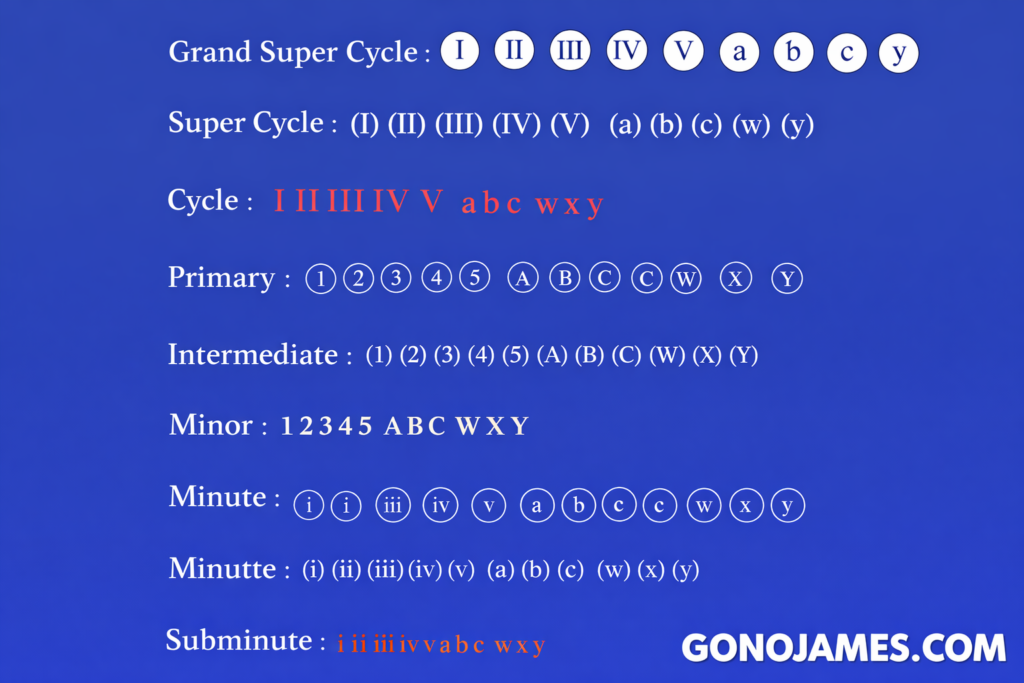
Elliott defined several wave degrees, ranging from very large, long-term cycles to very small, short-term price movements:
- Grand Supercycle: These waves can last for centuries and represent the largest market cycles.
- Supercycle: Typically lasting several decades and reflecting major economic trends.
- Cycle: Usually spanning one to several years and associated with broader business cycles.
- Primary: Lasting a few months to a couple of years and representing significant market trends.
- Intermediate: Typically lasting weeks to months and forming part of Primary waves.
- Minor: Lasting several weeks and acting as sub-waves of Intermediate waves.
- Minute: Lasting days and forming smaller structures within Minor waves.
- Minuette: Lasting hours and appearing within Minute waves.
- Sub-Minuette: Very short-term waves lasting minutes to hours.
Applying Wave Degrees in Trading
Correctly identifying wave degrees is essential for accurate market analysis. A wave that appears significant on a lower timeframe may only be a small part of a larger wave on a higher timeframe. For instance, a strong bullish move on a one-hour chart may be just a minor wave within a larger bearish trend on the daily chart.
By understanding wave degrees, traders can align their trading strategies with the overall market direction. Swing traders may focus on Primary and Intermediate waves, while day traders might concentrate on Minute and Minuette waves.
How to Label Elliott Waves Correctly
Wave labeling is one of the most important skills in Elliott Wave analysis. Proper labeling helps traders understand market structure and forecast future price movements with greater confidence. Elliott Waves are divided into two main categories: impulse waves and corrective waves.
Impulse Waves
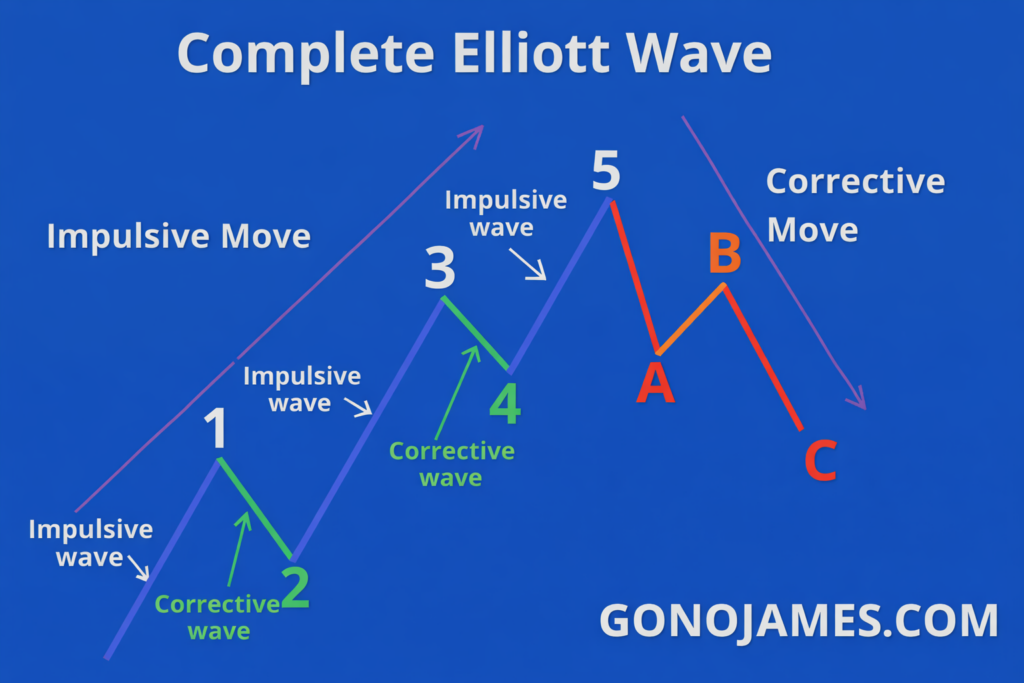
Impulse waves move in the direction of the main trend and consist of five waves:
- Wave 1: The first move in the direction of the new trend.
- Wave 2: A corrective move that retraces part of Wave 1.
- Wave 3: Usually the strongest and longest wave in the trend direction.
- Wave 4: A corrective wave that moves against Wave 3.
- Wave 5: The final wave that completes the impulse sequence.
Each impulse wave can be further broken down into smaller waves that follow the same five-wave structure. This reflects the fractal nature of the market.
Corrective Waves
Corrective waves move against the main trend and typically consist of three waves:
- Wave A: The first move against the main trend.
- Wave B: A temporary retracement of Wave A.
- Wave C: The final move that completes the correction.
Corrective patterns can take various forms, including zigzags, flats, and triangles. Each pattern has its own characteristics and requires careful analysis for proper identification.
Combining Fractals, Degrees, and Labeling
To use Elliott Wave Theory effectively, traders must combine fractal analysis, wave degrees, and proper labeling into one cohesive strategy. This integration provides a clearer view of the market and helps traders anticipate future price movements.
Multi-Timeframe Analysis
Multi-timeframe analysis is essential in Elliott Wave trading. By examining higher timeframes first, traders can identify the overall trend and major wave structure. Then, they can move to lower timeframes to find precise entry and exit points.
For example, a trader may identify a bullish Primary wave on the weekly chart and then look for buying opportunities during corrective waves on the four-hour chart.
Dynamic Wave Adjustment
Market conditions change constantly, and Elliott Wave counts may need to be adjusted as new price data becomes available. Successful traders remain flexible and open to alternative wave counts. This adaptability helps maintain accuracy and prevents costly mistakes.
Practical Tips for Successful Elliott Wave Trading
To maximize the effectiveness of Elliott Wave analysis, consider the following tips:
- Start with Higher Timeframes: Analyze weekly and daily charts first to understand the overall trend.
- Look for Clear Patterns: Focus on well-defined impulse and corrective structures.
- Use Fibonacci Ratios: Fibonacci retracements and extensions help identify key support, resistance, and target levels.
- Stay Flexible: Be ready to revise wave counts as the market evolves.
- Practice Regularly: Study historical charts and practice labeling waves to improve your skills.
Common Challenges in Elliott Wave Analysis
Ambiguous Wave Counts
Complex corrective patterns can sometimes make wave labeling difficult. Traders should consider multiple scenarios and wait for confirmation before making trading decisions. Using indicators such as RSI, MACD, or moving averages can help confirm wave counts.
Overtrading Small Waves
Focusing too much on short-term waves can lead to overtrading and missed opportunities in larger trends. Always align short-term trades with the dominant long-term trend to improve success rates.
Conclusion
Elliott Wave Theory provides a powerful framework for understanding financial markets and predicting future price movements. By recognizing the fractal nature of market behavior, identifying wave degrees, and applying accurate labeling techniques, traders can gain a significant advantage in Forex, stock, and cryptocurrency trading.
The key to mastering Elliott Wave analysis lies in patience, practice, and flexibility. By combining multi-timeframe analysis with proper wave identification and Fibonacci relationships, traders can improve their accuracy and confidence in the market. With consistent practice and disciplined application, Elliott Wave Theory can become one of the most valuable tools in any trader’s strategy for long-term success.